Prevalence of Disability
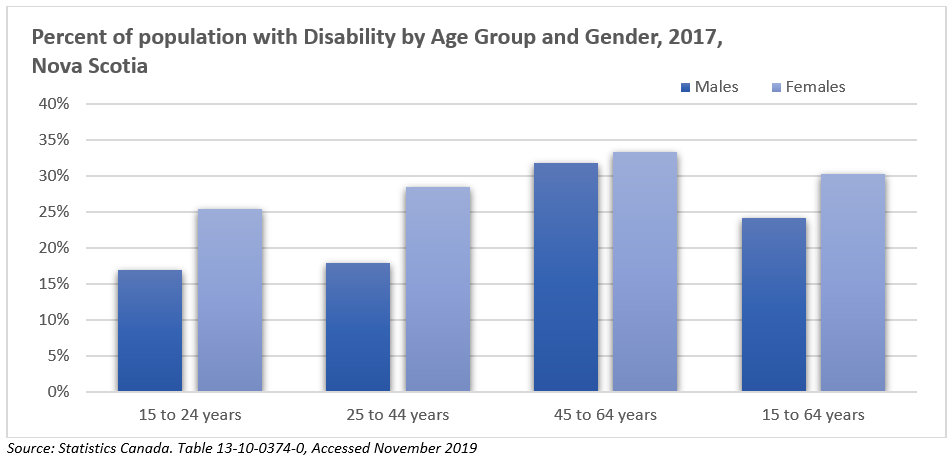
In 2017, approximately 161,460 people aged 15 to 64, or 27.3% of the population in this age group, reported being limited in their daily activities because of a mental or physical disability. Nova Scotia had the highest prevalence of disability in all the ten provinces. Prevalence of disability increased by age and was higher among females than males.
- Among adults aged 45 to 64 years, 32.7% reported having a disability.
- In contrast, 23.4% of those aged 25 to 44 years and 21.1% of individuals aged 15 to 24 years reported being limited in their daily activities by a mental or physical disability.
- Overall, 30.3% of females aged 15 to 64 years reported having a disability compared to 24.2% of males.
Labour Force Characteristics by Disability
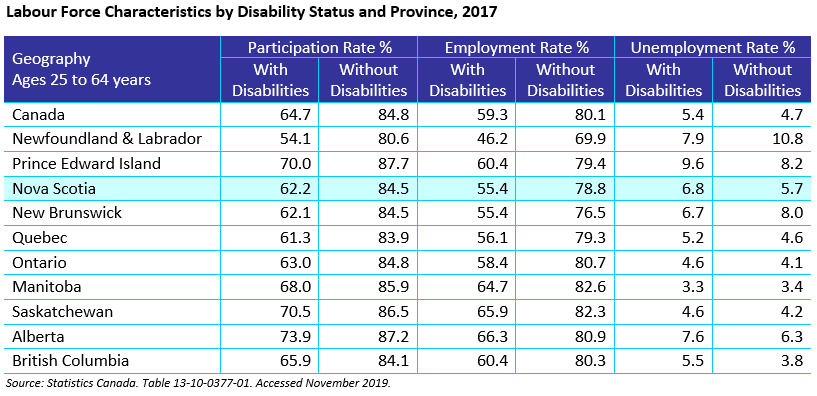
- Nova Scotia’s employment rate for people with disabilities (55.4%) is 23.4 percentage points lower than the rate for those without disabilities (78.8%) and is lower than the national rate (59.3%).
- Nova Scotia ties with New Brunswick for 8th place, out of ten provinces.
- The unemployment rate for people with disabilities in Nova Scotia (6.8%) is 1.1 percentage points higher than the unemployment rate for those without disabilities.
- Nova Scotia’s unemployment rate for people without disabilities (5.7%) is average among the ten provinces and its rate for those with disabilities is the fourth highest among the provinces.
Type of Disability
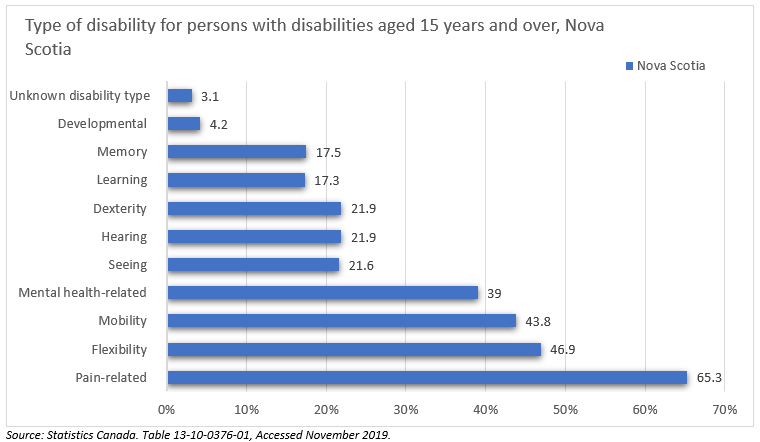
The prevalence of disabilities varies at different stages of life. Common to all age groups, however, was the prominence of pain-related disabilities—which were the most prevalent disability type among working-age adults.
- Among working age, 65.3% had a pain-related disability, and roughly half that percentage had a disability related to mental health, flexibility or mobility (and often in combination).
- Mental health-related disabilities (39%) ranked fourth in prevalence among disability types for persons aged 15 years and over and represented just over 89,000 Nova Scotians.
- In fact, among youth, mental health-related (66.8%) was the most common type of disability, followed by learning (39.4%), and pain-related disabilities (30.1%).
Employment Rate by Type of Disability
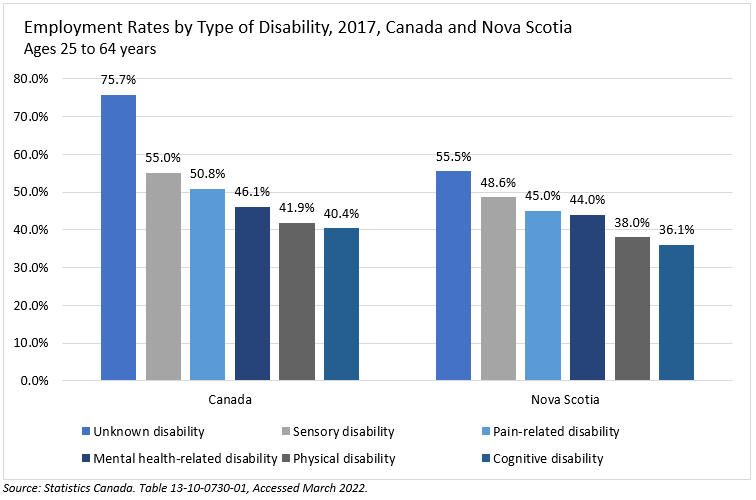
Among people with disabilities, employment rates are affected by the type of disability. This trend is observed at both the national and provincial levels.
- People with sensory disability are most likely to be employed among all the known disabilities, with 55% of Canadians and 48.6% of Nova Scotians with this type of disability working in 2017.
- The second group is people with pain-related disabilities.
- On the other hand, people with cognitive disabilities are least likely to find employment.
- Only 36.1% of Nova Scotians with a cognitive disability worked in 2017 and 40.4% of Canadian peers worked in 2017.