Labour Productivity 2023
Labour productivity measures the amount of goods and services produced by one hour of labour -- it captures how efficiently goods and services are produced.
Many things affect labour productivity. These include how skilled workers are, how much money is put into the business, new ideas, how well the business is run, rules set by governments, and other things happening around the world. Improving productivity is not just up to governments. Companies and their managers have a role to play.
In 2023, Nova Scotia had the second lowest productivity of all the provinces. It was only higher than Prince Edward Island. Workers in Nova Scotia produced about $43.70 of value for every hour they worked.
Nova Scotia also had the second lowest labour productivity (after Prince Edward Island) in 2022 at $44.60.
- Labour productivity in Nova Scotia was lower than the national level in all industries, except for two:
- In the services sector, specifically in “information and cultural industries”
- In the information and communication sector focusing on “Information and communication technology, services”
- Labour productivity is calculated by dividing the real value added by the estimated number of hours worked. Provinces like Alberta, Saskatchewan, and Newfoundland and Labrador generate high amounts of real value-added because they have large resource and/or capital-intensive industries that do not require as many hours of work. This drives up the national average for productivity.
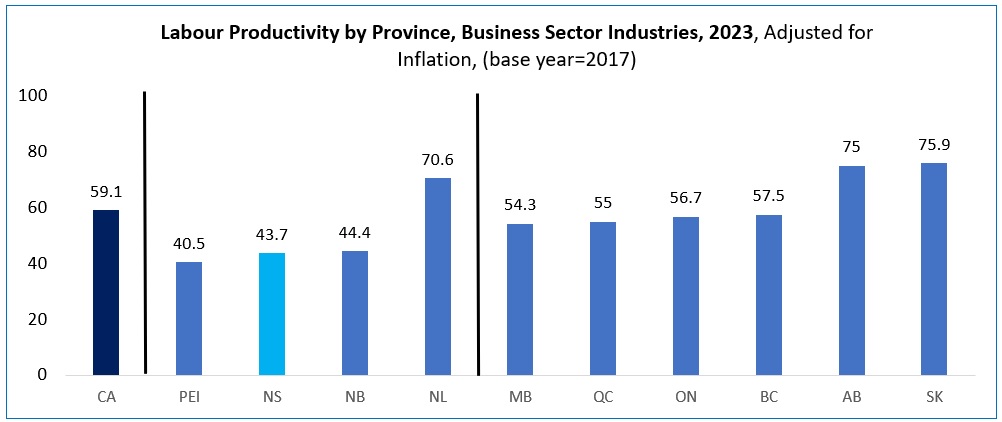
Source: Statistics Canada Table 36-10-0480-01
Productivity Growth
Due to resource and capital intensity differences among provinces, it is also important to look at productivity growth rates. Nova Scotia’s productivity growth between 2019 and 2023 was on par with the national average. Between 2019 and 2023, Newfoundland and Labrador had the lowest labour productivity growth, and British Columbia had the highest.
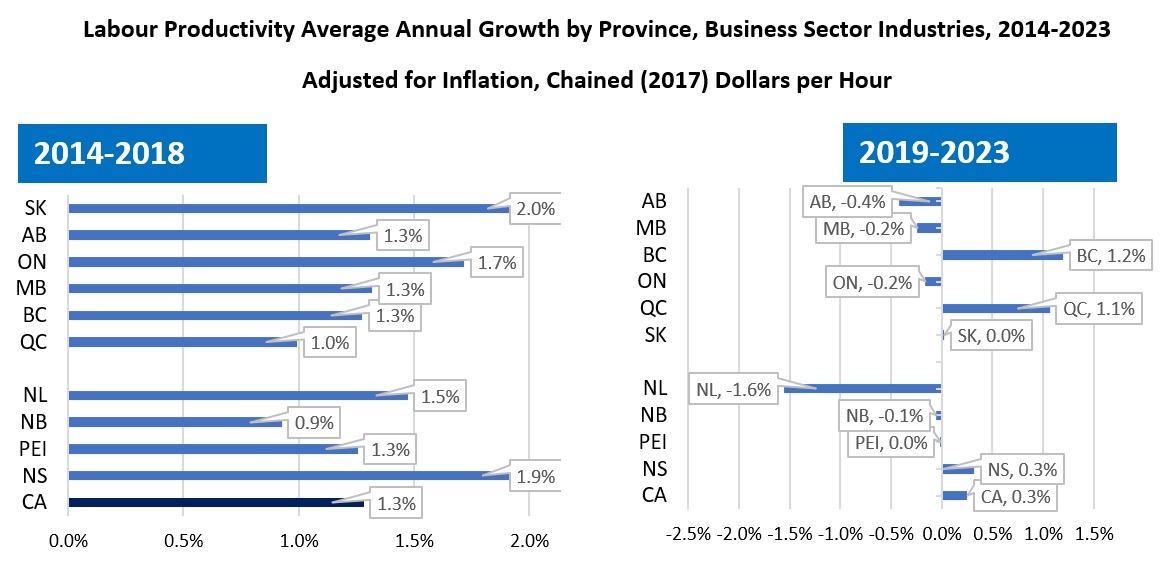
Source: Statistics Canada Table 36-10-0480-01
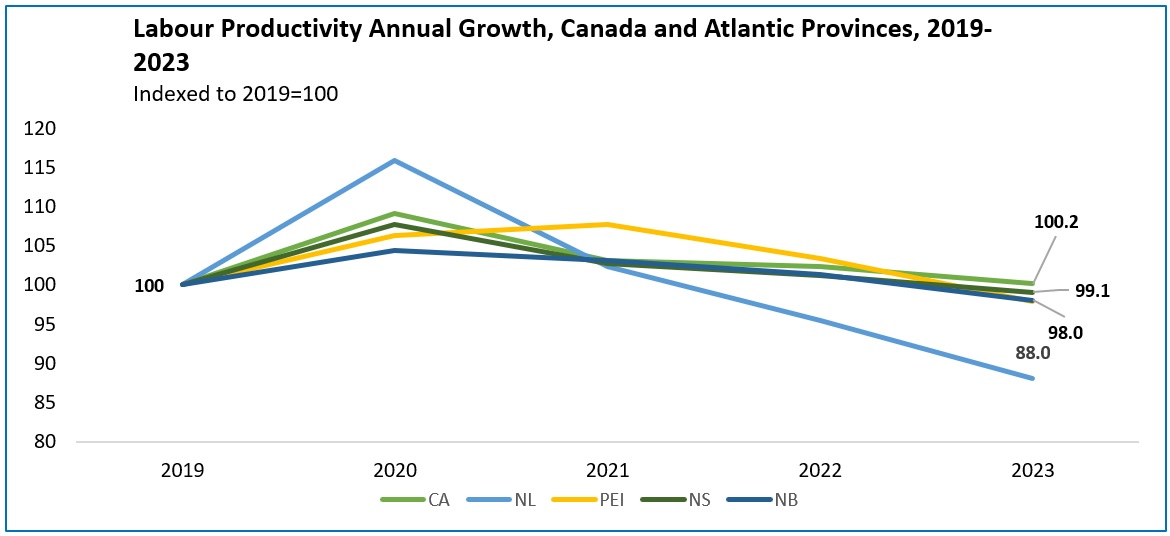
Source: Statistics Canada Table 36-10-0480-01
- In 2020, when COVID-19 started, Canada saw a large increase in productivity. This was mainly because low-productivity jobs were lost due to pandemic shutdowns. The total hours people worked went down by 11% compared to the year before. Low-wage jobs in places like hotels and restaurants and in retail stores were hit the hardest. Real business sector GDP fell less than the number of hours worked, raising labour productivity.
- As public health restrictions eased in 2021, the number of hours worked increased significantly across many industries without as large an increase in real GDP. This meant productivity went down in most provinces, except for Prince Edward Island and New Brunswick, which had small gains.
- In 2022, there was a decrease in labour productivity in Nova Scotia compared to 2021. At the same time, total actual hours worked increased in both the goods and services producing sectors. Actual hours worked decreased in the service producing sector among self-employed workers.
- In 2023, Nova Scotia’s labour productivity decreased again compared to 2022.