- The labour force includes all the people who are either working or actively looking for work.
- By understanding labour force trends, individuals and businesses can make better plans for the future.
- Youth are workers between the ages of 15 and 24.
- Core-aged workers are those between 25 and 54.
- Older workers are those over the age of 55.
Age Distribution in the Workforce
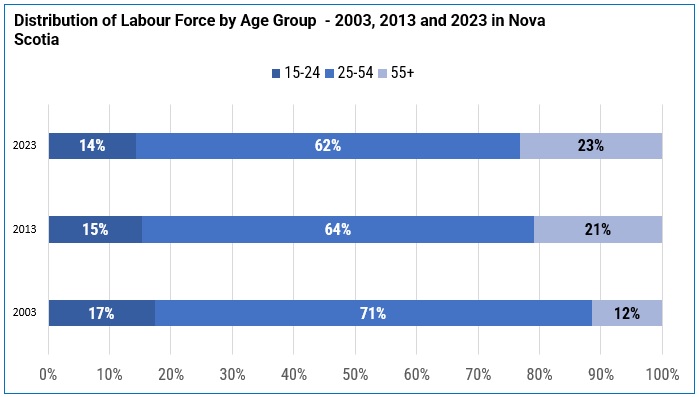
Nova Scotia has a growing percentage of older workers compared to youth and core-aged workers
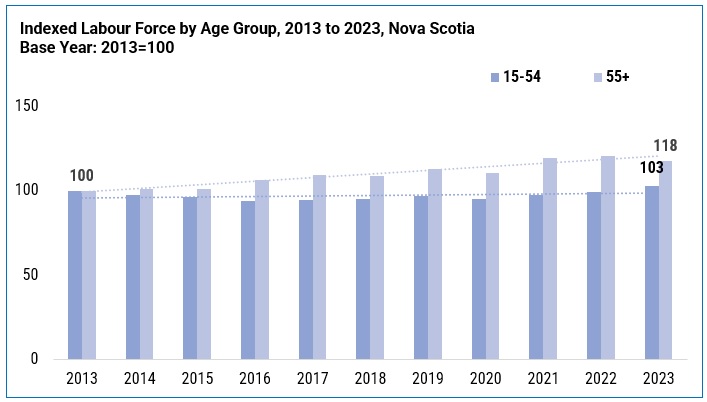
In Nova Scotia, the makeup of the workforce is changing because of the aging baby boomer population, who were born between 1946 and 1964. Over the past ten years, the number of people working in Nova Scotia has stayed about the same because more older workers are in the workforce.
However, there are fewer youth workers and core-aged workers compared to before. Since 2013, there have been more older workers than youth workers, and this trend continued in 2023.
Calculations based on Statistics Canada Table 14-10-0327-01 Labour force characteristics by sex and detailed age group, annual.
For workers 55 years of age and above:
- Between 2003 to 2013, the share of older workers in the workforce went up from 12% to 21%. This increase happened mainly because the baby boomer generation entered the older worker demographic.
- From 2013 to 2023, the proportion of older workers continued to grow, going from 21% to almost 23%.
- In 2023, older workers made up 23% of all workers in Nova Scotia, which is the highest it has been since they started keeping records in 1976.
- At the same time, the proportion of people aged 55 and over who were not in the workforce also increased. In 2003, 62% were not working, 69% in 2013, and by 2023, it had increased to 75%.
Youth workers - between 15 and 24 years of age:
- In 2003, youth made up 17% of all workers
- By 2013, that number had gone down to 15%.
- In 2023, it fell even more to 14%.
The core age workers – between 25 and 54 years of age:
- In 2003, people in the prime working age group made up 71% of all workers.
- By 2013, that number went down to 64%.
- And in 2023, it fell even more to 62%.
Over time, there have been fewer people in the prime working age group compared to the total number of workers. In 1997, it was at its highest point, with 75% of workers being in that age group.
Calculations and indexing based on Statistics Canada Table 14-10-0327-01 Labour force characteristics by sex and detailed age group, annual.
Participation Rates:
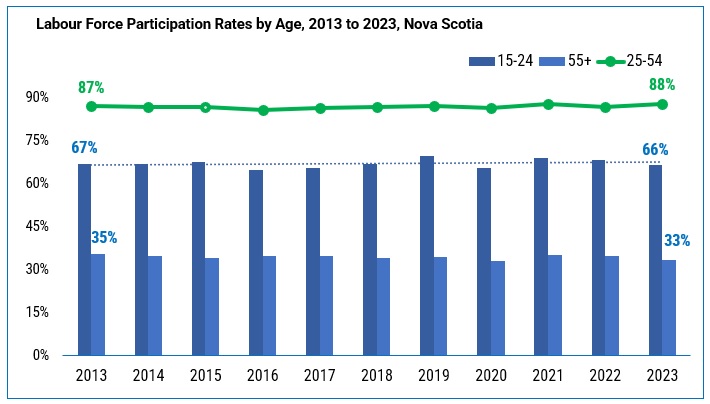
The participation rate is rising among youth, core-age workers, as well as older workers
Here is a breakdown of how the labour force participation rate works and some factors that affect it:
- The labour force participation rate shows how many people in a country or region’s working age population are either working or looking for work.
- Factors like how old people are, what kinds of jobs are available, and how many people are in school can affect participation rates.
- More young people going to school can lower youth participation rates, but having fewer babies boosts it. In 2019, youth participation hit its highest level since 1976 at 69.8%, but by 2023, it had dropped to 66.4%.
- Historically, youth have lower participation rates than those in the core-aged group, but higher rates than older workers.
- Over the last decade, the gap between youth and older worker participation rates has grown slightly due to the changing demographics in Nova Scotia, but more people delaying retirement has helped keep it from growing more.
- Participation rates have gone up a bit for youth, core-aged workers, and older workers, even though we usually expect participation to go down as people get older.
- People who have retired are not counted as participants, which lowers participation rates for older workers.
Calculations based on Statistics Canada Table 14-10-0327-01 Labour force characteristics by sex and detailed age group, annual.
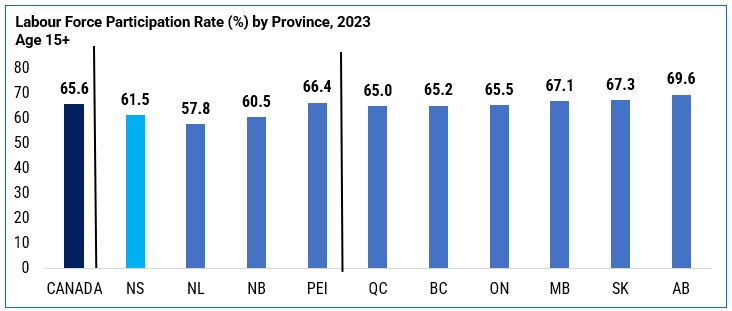
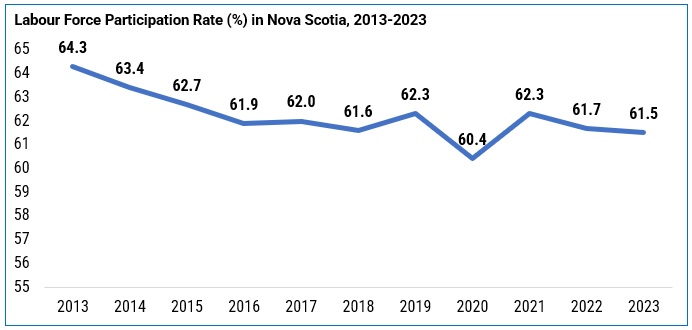
- In 2023, the participation rate in Nova Scotia was 61.5%. That is lower than the national average of 65.6%. Among the four Atlantic Canadian provinces, Nova Scotia had the second-highest participation rate, but it was the third lowest compared to all ten provinces.
- Nova Scotia’s participation rate went down by 0.2 percentage points from 2022.
Calculations based on Statistics Canada Table 14-10-0327-01 Labour force characteristics by sex and detailed age group, annual.
- In Nova Scotia, except for the recent impact of COVID-19, the participation rate has mostly gone down each year since 2013.
Calculations based on Statistics Canada Table 14-10-0327-01 Labour force characteristics by sex and detailed age group, annual.