More jobs were available in Nova Scotia in 2023, both full-time and part-time. Most of these new jobs were in industries that provide services, rather than making products.
In 2023, Nova Scotia saw more people finding work compared to the pervious year, with an employment increase of 2.7%, which equals 12,900 new jobs. Full-time jobs went up by 1.9%, adding 7.500 positions. Part-time jobs increased by 6.5%, making up 5,400 more jobs.
Services-producing sector:
- In 2023, the services sector made up 82% of all jobs in Nova Scotia.
- Most of the new jobs came from the services sector, which gained 17,400 positions, a 4.5% increase.
- Within this sector, both full-time and part-time jobs went up, adding 12,800 and 4,700 jobs each.
- The wholesale and retail trade industry saw the most growth with 4,700 new jobs (+6.3%), followed by information, culture, and recreation with 3,600 added positions (+22.2%).
- The healthcare and social assistance industry had the biggest loss, with 2,600 fewer jobs (-3.3%).
Goods-producing sector:
- The goods producing sector accounted for 18% of jobs.
- The sector lost 4,600 jobs, mostly full-time positions (5,300, -5.9%), but gained some part-time roles (700, +11.1%).
- Manufacturing gained 1,000 positions (+2.9%), and agriculture saw an increase of 200 jobs (+3.9%).
- Construction lost the most jobs, down by 4,000 positions (-9.5%).
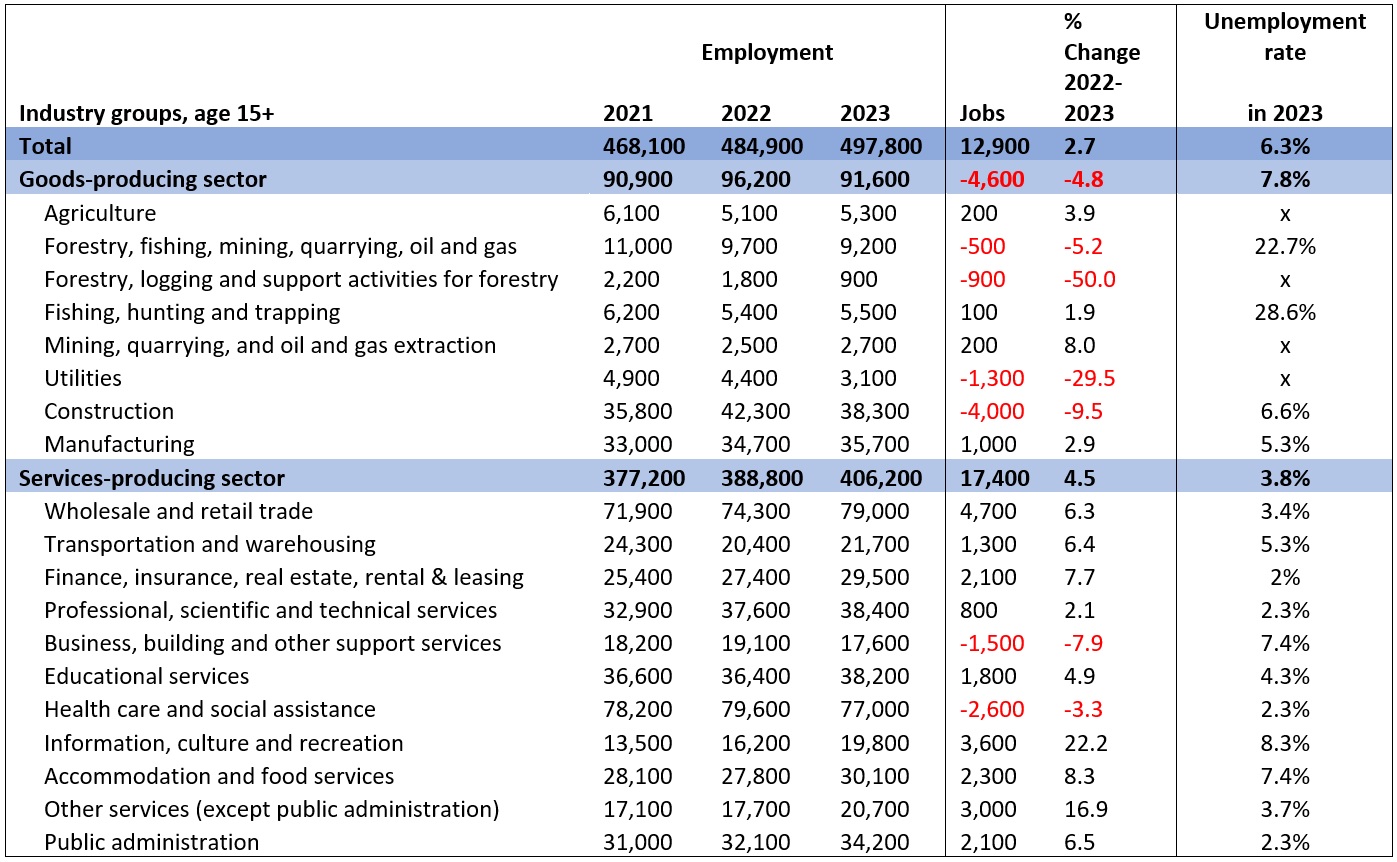
Source: Calculations based on Statistics Canada Table: 14-10-0023-01
Unemployment
In 2023, the unemployment rate dropped by 0.2 percentage points, reaching 6.3%. This is the lowest it has been since records began in 1976.
- In 2023, the average yearly unemployment rate was 6.3%, which is the lowest it has been since 1976.
- The goods-producing sector had a higher average unemployment rate, about twice as high as the services-producing sector.
- Over the past decade, from 2013 to 2023, the average yearly unemployment rate was 8.1%.
Employment
Across the country in 2023, there were more jobs in both the goods-producing and services-producing sectors. But in Nova Scotia, there were fewer jobs in the goods-producing sector.
Employment growth in the goods-producing sector – comparison between Nova Scotia and Canada:
- Between 2012 to 2016, there was a big gap between Nova Scotia and Canada in how many jobs were created in the goods-producing sector.
- While Canada’s job growth stayed about the same during this time, Nova Scotia saw a decrease of 9% in these types of jobs. Between 2017 and 2020 the difference reduced and disappeared in 2021.
- In 2022, Nova Scotia had 6.9% more jobs in the goods-producing sector compared to 2012, while Canada had a 4.0% increase. But in 2023, Canada had a 5.6% increase compared to 2012, while Nova Scotia only had a 1.8% increase.
- Nationally, there was a 1.5% increase in these types of jobs in 2023, but in Nova Scotia, there was a decrease of 4.8%.
Employment growth in the services-producing sector – comparison between Nova Scotia and Canada:
- From 2012 to 2019, more jobs were created in the services-producing sector across Canada. But in Nova Scotia, there sector struggled from 2012 to 2015, with a 2.1% decrease in employment before bouncing back and growing by 6.9% from 2016 to 2019.
- The COVID-19 pandemic in 2020 caused job losses in this sector in both Nova Scotia (-5.4%) and Canada (-5.9%). But in 2021, employment recovered, with a 5.7% increase in Nova Scotia and a 5.4% increase nationally. In 2022, there was a 4.0% increase in Canada and a 3.1% increase in Nova Scotia.
- In 2023, both Nova Scotia and Canada saw more employment in the service industries, with a 4.5% increase in the province and a 2.7% increase nationally.
- Over the past ten years (2013-2023), employment in the services-producing sector grew more nationally (16.4%) compared to Nova Scotia (10.9%).
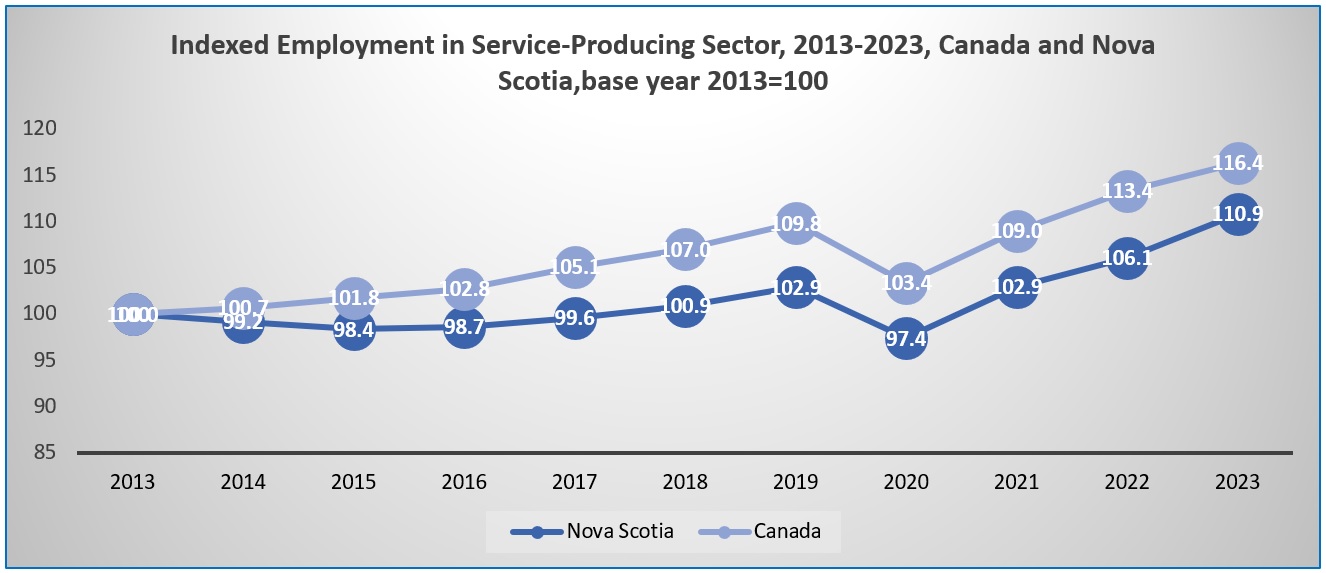
Source: Calculations and indexing made based on Statistics Canada Table: 14-10-0023-01
Document
Industry Trends 2023 Charts.xlsx
(19.99 KB)