Diversity Overview
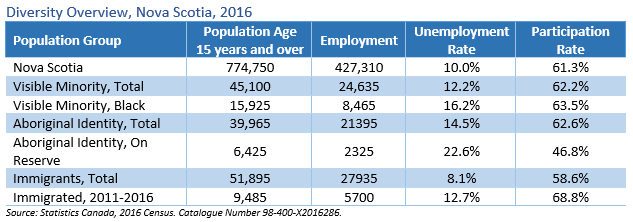
An overview of selected diversity groups in Nova Scotia reveals that only immigrants had a lower unemployment rate (8.1%) than that of the whole province (10.0%) in 2016. Aboriginal peoples living on reserve experienced the highest unemployment rates at 22.6% and the lowest participation rate, 46.8%.
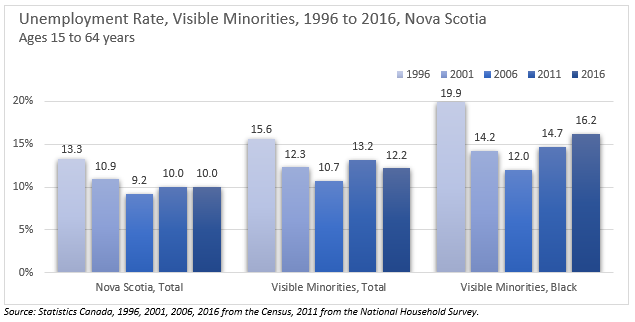
Unemployment Rate
After the economic downturn in 2009, Nova Scotia recorded an increased unemployment rate in the 2011 National Household Survey as compared to the 2006 Census. Following another downturn in 2012, the province recorded no change in the unemployment rate compared to the National Household Survey.
The unemployment rate is more pronounced for visible minorities than it is for all of Nova Scotia. Between 2011 and 2016 the unemployment rate for visible minorities fell 1.0 percentage points but rose 1.5 percentage points for the black population.
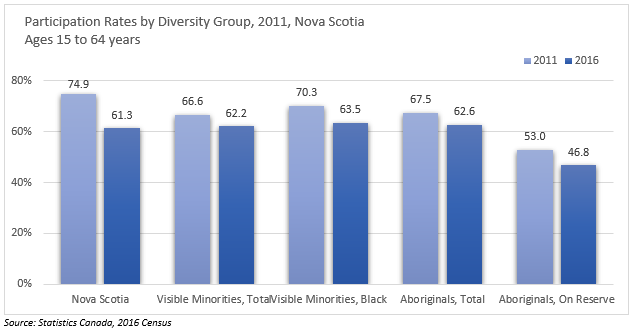
Labour Force Participation Rate
The participation rate for Nova Scotia, and all examined diversity groups, deteriorated in 2016 from 2011. The rate for the province experienced a significant decrease, dropping 13.6 percentage points (74.9% to 61.3%). Relative to all groups, the rate for visible minorities suffered the least, falling only 4.4percentage points (going from 66.6% to 62.2%).
The black population and aboriginals on reserve experienced larger decreases in participation of 6.8 and 6.2 percentage points respectively. Except for Aboriginals on reserve, all groups had greater participation rates than the provincial average rate.
Immigrants - Employment Rate
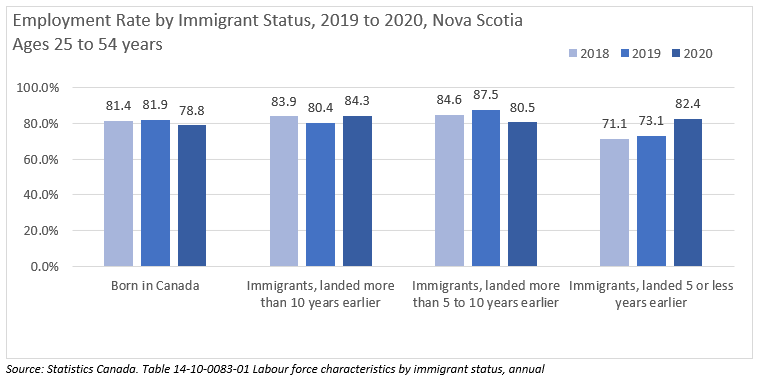
Employment rates for immigrants in Nova Scotia tend to be lower than that of non-immigrants. However, it is important to note the age and gender makeup of the immigrant and non-immigrant population differ, which affects employment rates.
The graph below shows employment rates by immigrant status in Nova Scotia for those aged between 25 and 54 years. In 2018, the percentage of non-immigrants, or those born in Canada, aged 25 to 54 years who were employed was 81.4% compared to 79.4% for all immigrants. However, by 2020 the employment rate for immigrants was 82.9%, surpassing that of non-immigrants at 78.8%.
- Historically, recent immigrants to the province (within the last five years) tended to have lower employment levels than those landing five or more years ago.
- The employment rate for recent immigrants increased from 71.1% in 2018 to 82.4% in 2020. This exceeds the 2020 rates of 80.5% among immigrants landed five to ten years ago and 84.3% among immigrants landed more than ten years ago.
- The employment rate for immigrants having landed between five and ten years earlier rose in 2019 before falling in 2020 and remains 4.1 percentage points below the 2018 level. In comparison, the employment rate among immigrants having landed more than ten years ago was 0.4 percentage points higher in 2020 then in 2018.
- Among Canadian born Nova Scotians, the 2020 employment rate was 2.6 percentage points lower than the 2018 level.
Employment Growth
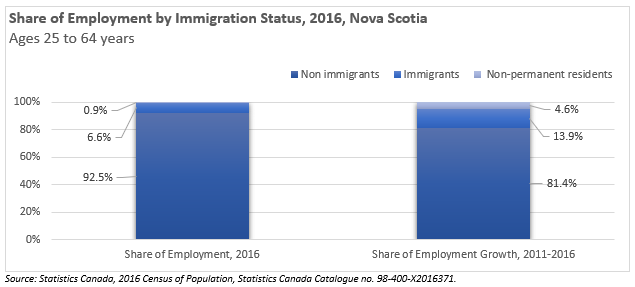
Immigrants and non-permanent residents (students with work permits, temporary foreign workers, or refugee claimants) constituted 6.6% and 0.9%, respectively, of employed Nova Scotians in 2016. Between 2011 and 2016, Nova Scotia’s employment growth was largely due to the contribution of non-immigrants and immigrants. Their respective shares of the overall employment growth In Nova Scotia were 81.4% and 13.9%..
Educational Attainment
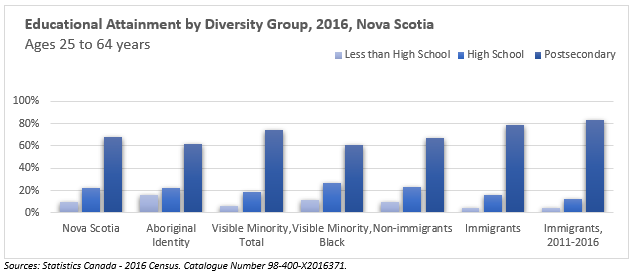
Rates of postsecondary educational attainment vary across diversity groups. In 2016, immigrants had the highest rate (79%) of educational attainment in Nova Scotia (among adults aged 25 to 64). Postsecondary educational attainment for recent immigrants (those who emigrated between 2011 and 2016) was 83%.
The black population and those who reported Aboriginal identity had the lowest percentages of postsecondary educational attainment (61% and 62% respectively) and were also the only groups with a postsecondary educational attainment lower than that of Nova Scotia as a whole (68%).
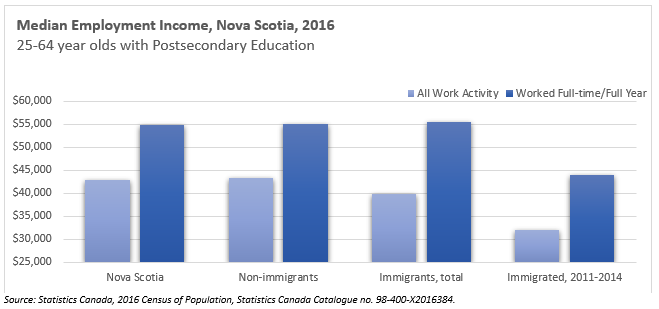
Employment Income
Immigrants with a postsecondary educational attainment who worked full-time, full year had a higher median employment income ($55,575) than non-immigrants ($54,969) and the overall Nova Scotia median employment income ($54,904) in 2016.
The median income for recent immigrants who worked full-time, full year was significantly lower than that of non-immigrants ($44,021). Alternately, fewer immigrants (52.6%) worked full-time, full year compared to non-immigrants (59.3%). Only 45.9% of recent immigrants (Immigrated, 2011 – 2014) worked full-time, full year hence their median income ($31,926) for all work activity was lower than that of non-immigrants ($43,283) and immigrants overall ($39,867).