Indigenous people in Canada include:
- First Nations
- Metis
- Inuit/Inuk
Being a Registered or Treaty Indian, means you are officially recognized under the Indian Act of Canada, or you belong to a First Nation band that signed a treaty with the Crown. Inuit and Metis aren’t included in the Indian Act of Canada.
Nova Scotia Has the Second-Highest Indigenous Population in Atlantic Canada
In 2021, there were 52,430 Indigenous people are living in Nova Scotia. Across Canada, the were 1.8 million Indigenous people, making up about 5% of the Canadian population.
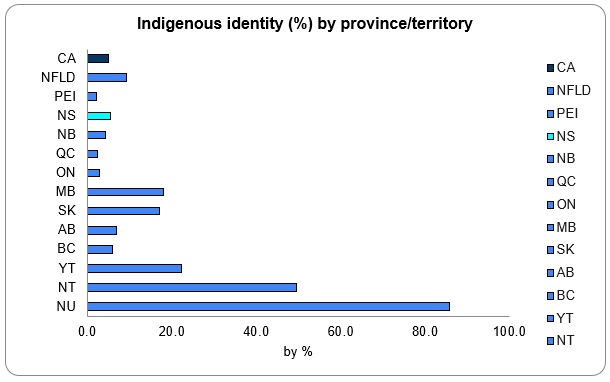
- In Atlantic Canada, Nova Scotia has the second-highest Indigenous population, with about 5.5% of its people identifying as Indigenous.
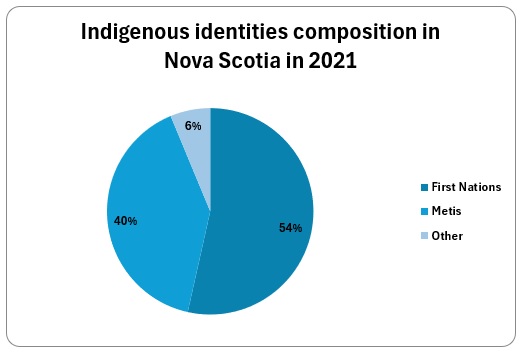
Most of Nova Scotia’s Indigenous Population Identifies as First Nations
Of the Indigenous population in Nova Scotia (both on and off reserve):
- First Nations – 28,050 or 53.9% of the Indigenous population
- Metis – 21, 090 or 40.2%
- Other Indigenous identities – 3,285 or 6.5%
Eskasoni is the largest Mi’kmaq community in the world
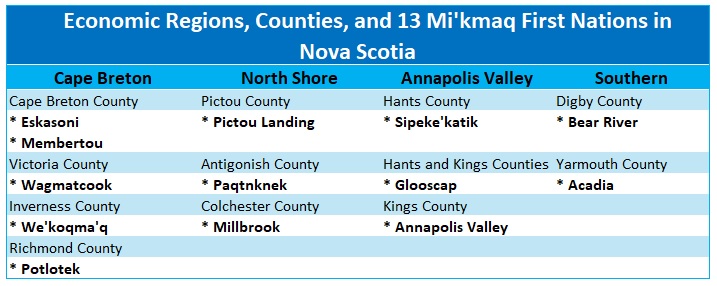
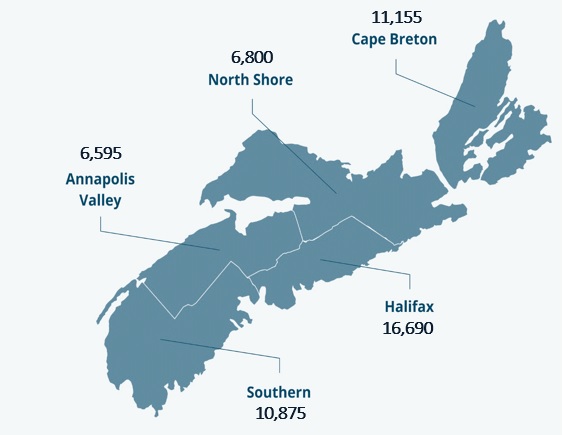
- In Nova Scotia, most First Nations are Mi’kmaq. There are 13 Mi’kmaq First Nations based in four Economic Regions. Other First Nations have locations all over the province.
- The biggest Mi’kmaq community in the world is Eskasoni, which is in Cape Breton County. In 2021, it had 3,422 people.
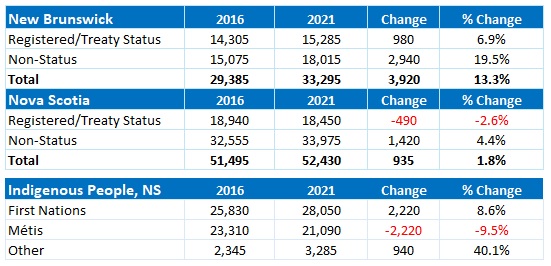
Despite growth in numbers, the share of Indigenous population declined
- Even though there are more Indigenous people in Nova Scotia overall, their share of the total population dropped slightly from 5.7% in 2016 to 5.5% In 2021.
- The growth in the Indigenous population in the province mainly came from First Nations and people without Registered/Treaty status.
- In 2021, the number of Registered/Treaty Status Indigenous people decreased by 490 people (-2.2%) compared to 2016, while the number of people without status increased by 1,420 people (+4.4%).
- The biggest decrease was among those who identified as Metis which went down by 9.5%, or -2,220 individuals from 2016. The number of self-identifying Metis had more than doubled between 2011 and 2016.
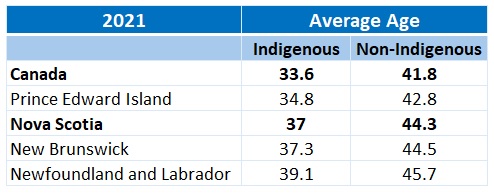
Indigenous people are younger than the overall population, having a lower average age
- In Nova Scotia and all across Atlantic Canada, Indigenous people are generally younger than non-indigenous people. In Nova Scotia, the average age of Indigenous people is 37, while the average age for everyone else in the province is 44.3.
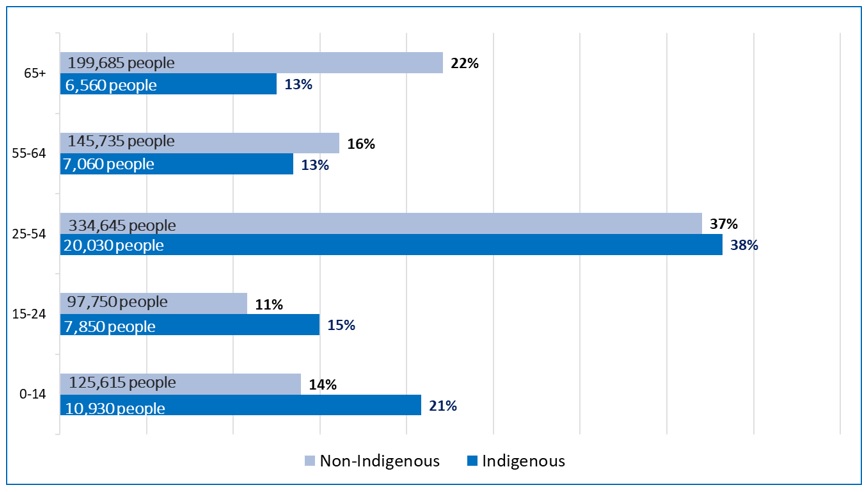
- Compared to everyone else in Nova Scotia, Indigenous people are more likely to be younger, with more of them falling into the age groups of 0 to 14 and 15 to 24. There are fewer Indigenous people who are over 55 years old.
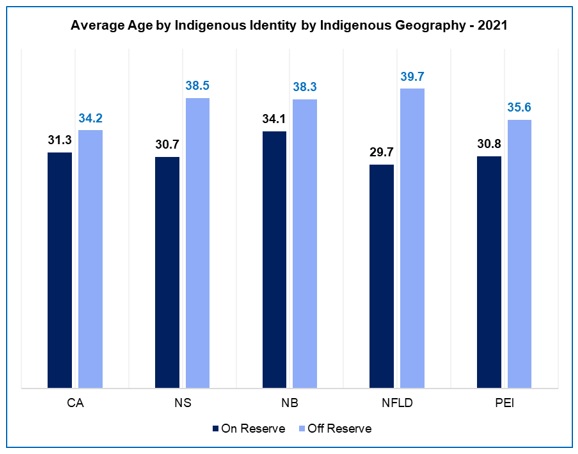
Age Structure of Indigenous Population – 2021 Nova Scotia
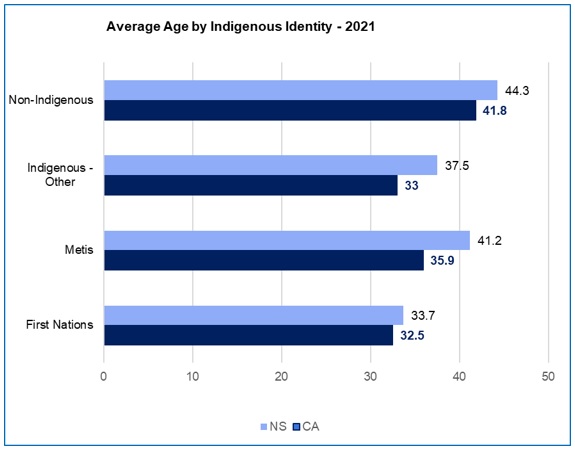
- Average age also varies by Indigenous identity and location of residence.
Those living off-reserve were more likely to have post-secondary education
Higher educational attainment is strongly correlated with higher income and labour market outcomes.
Post-secondary Education – Bachelor’s Degree or More in 2021
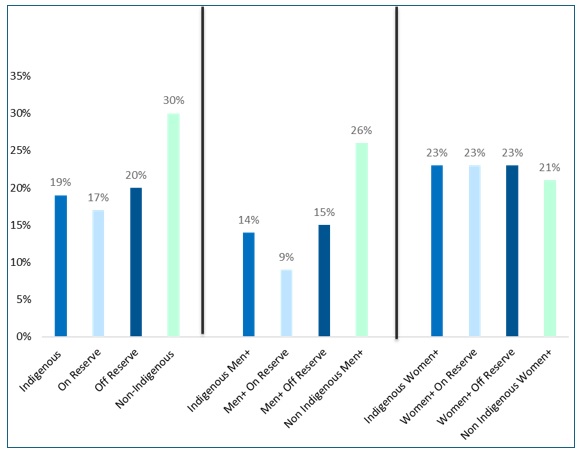
- About 30% of non-Indigenous people in Nova Scotia had bachelor's degree or higher, while only about 19% of Indigenous people do.
- Among those with a bachelor’s degree or higher, about 17% live on reserve, compared to 20% living off-reserve.
- Only about 14% of Indigenous men have a bachelor’s degree or higher, whereas about 26% of non-Indigenous men do. Among those living on reserve, only about 8% of men have a bachelor’s degree or higher, compared to 14% living off reserve.
- For women, about 23% both those on and off reserve have a bachelor’s degree or higher, while it is about 35% for non-Indigenous women.
Source: Statistics Canada 2021 Census