Indigenous people in Canada include:
- First Nations
- Metis
- Inuit/Inuk
Being a Registered or Treaty Indian, means you are officially recognized under the Indian Act of Canada, or you belong to a First Nation band that signed a treaty with the Crown. Inuit and Metis aren’t included in the Indian Act of Canada.
The total Indigenous labour force declined between 2016 and 2021
In 2021, there were 24,660 Indigenous people in the labour force (aged 15+). Among them, 21,365 lived off-reserve, and 3,290 lived on-reserve. This number is 375 fewer people than in 2016.
The participation rate was lower in the on-reserve Indigenous population
The participation rate shows how many people in the workforce are either working or actively searching for a job. It affects the unemployment rate. The participation rate tells us how willing people of working age are to join the workforce.
- In 2021, fewer people living on reserves were either working or looking for work (47.3%) compared to those living off-reserve (61.9%) or non-Indigenous people (59.5%).
- This has been a trend for the past decade and continues to be the case. The participation rate for Indigenous people in 2021 was lower than it was during both the 2016 and 2011 censuses.
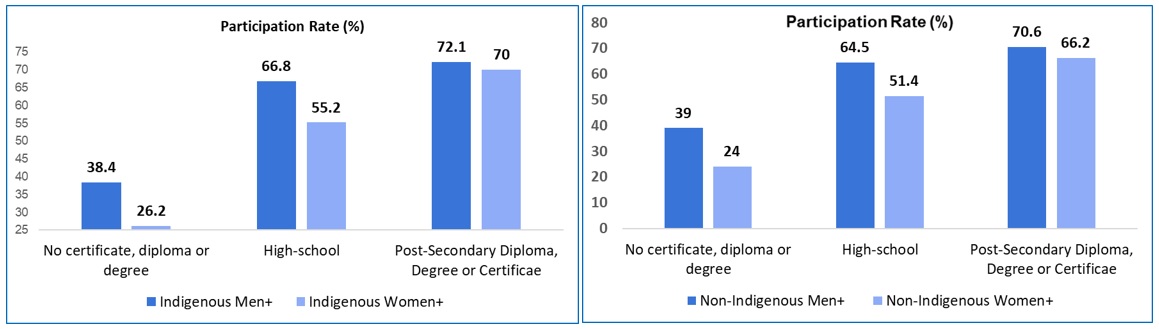
- Over the last decade, Indigenous women have had lower participation rates in the workforce compared to Indigenous men. This is even though more women than men have bachelor’s degrees or higher, whether they live on or off-reserve.
- This could be because Indigenous women often marry earlier and start families, which can delay them from joining the workforce after finishing their education.
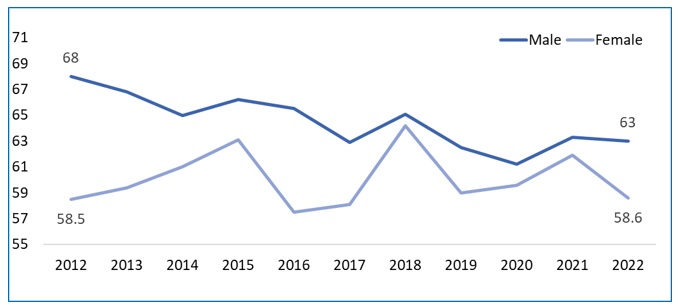
Participation Rate (%) by Gender, 2012-2022, Atlantic Canada
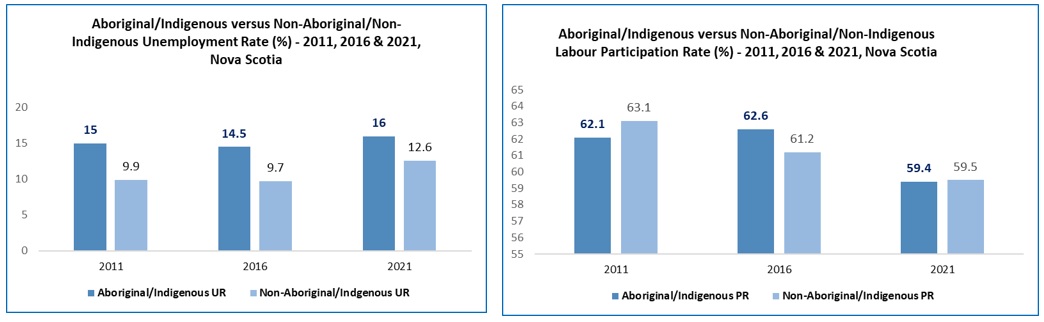
The unemployment rate was higher for those on-reserve
The unemployment rate is the percentage of people who are looking for a job and can’t find one, compared to all the people who are either working or looking for work. When we talk about the unemployment rate for a specific group, like a certain age group or gender, it is the percentage of unemployed people in that group compared to all the people in that same group who are working or looking for work.
- On reserves, the unemployment rate was 21%, while off-reserve it was 15.2%.
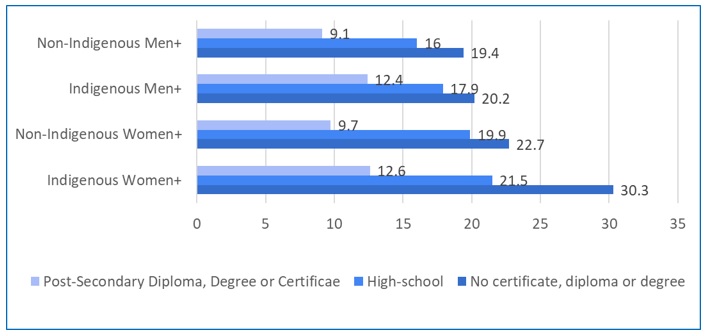
- Even among people with a bachelor’s degree or higher, those living on reserves had a higher unemployment rate at 9.2% compared to those off-reserve at 8.6%.
- For men with a bachelor’s degree or higher, those on reserves had a higher unemployment rate at 11.1% compared to those off-reserve, who had a rate of 8.8%.
Unemployment Rate (%) and Educational Attainment for Indigenous Men+ and Women+ in 2021
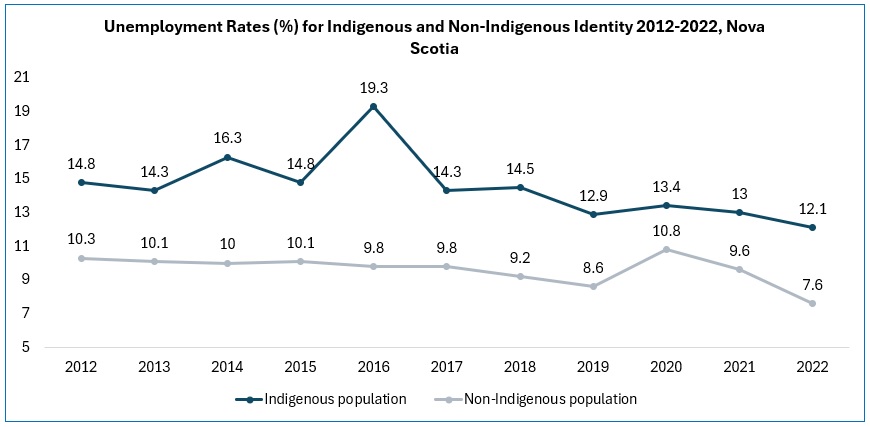
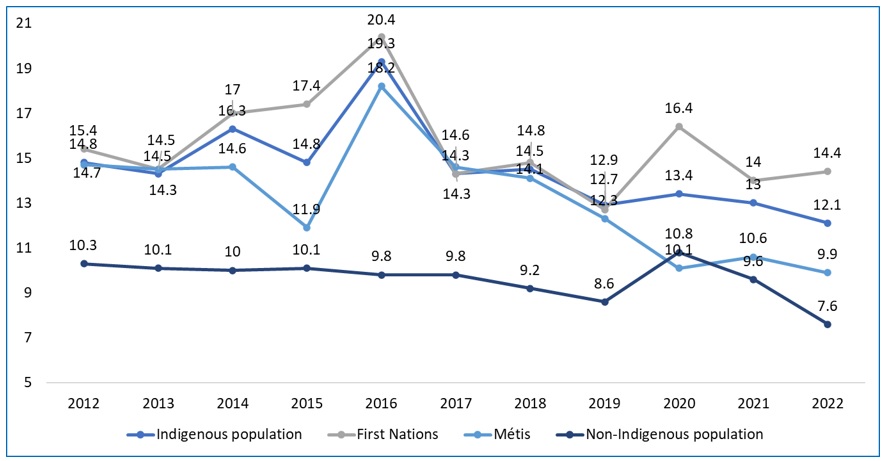
- In 2021, the unemployment rate for Indigenous people was 12.1%, which was the lowest it had been in the past 10 years. However, it was still much higher than the unemployment rate for non-Indigenous people, which was 7.6%.
- The unemployment rate in the past 10 years was consistently higher for First Nations than for Metis individuals.
Unemployment Rates (%) for Indigenous and Non-Indigenous Identity 2012-2022, Atlantic Canada
Source: Statistics Canada 2021 Census